In this chapter I will teach you the basics of charting – the very foundation we will build on in the next chapters.
You will learn:
- What is Support and Resistance
- How to draw Support and Resistance levels correctly
- How to draw trendlines
- What are Breakouts and Pullbacks
- How To Time Entries
Support and Resistance.
These ideas are at the very core of Chartism and Technical Analysis, and almost all Chart Patterns involves them in some way. We will now define Support and Resistance and describe the ways they may appear in the markets. Support and Resistance are psychological levels which price has difficulties to break. Many reversals of trend will occur on these levels. When a certain level is difficult for price to cross upwards – it is called Resistance.
When a certain level is difficult for price to cross downwards – it is called Support. The harder for price to cross a certain level, the stronger it is and the profitability of our trades will increase. Try to trade on levels that price stopped on at least twice. The most basic form of Support and Resistance is horizontal. Examples:
When a certain level is difficult for price to cross downwards – it is called Support. The harder for price to cross a certain level, the stronger it is and the profitability of our trades will increase. Try to trade on levels that price stopped on at least twice. The most basic form of Support and Resistance is horizontal. Examples:
Strong horizontal levels are round levels - 1.1300, 148.0, 130, etc. These levels are usually prone to high activity from buyers and sellers, and therefore usually cause reversals in price.
An interesting phenomenon can occur when price breaks a psychological level: Support level can transform into Resistance, and vice versa. This knowledge gives you the power to predict price reversals. Example:
An interesting phenomenon can occur when price breaks a psychological level: Support level can transform into Resistance, and vice versa. This knowledge gives you the power to predict price reversals. Example:
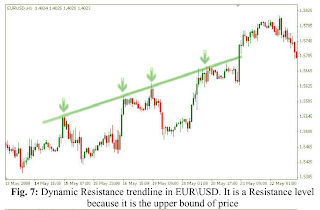
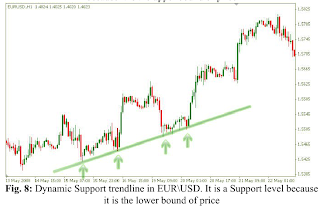
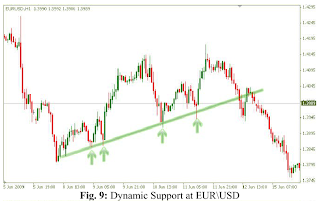
Another visual representation of Support and Resistance is dynamic – the Trendline. This is a sloped line which is difficult for price to penetrate. There are support trendlines and resistance trendlines - depending on their position in relation to price. Examples for trend lines:
All the chart patterns we will cover in this book consist of trendlines and psychological levels. Study these examples well and test your knowledge by identifying trendlines in your trading platform. Next chapter 3-Breakout and Pullback


0 comments:
Post a Comment